Data Visualization
Free your data to tell the story it has always been waiting to tell. We will help you gain 360-degree visibility into your data with interactive reports and intuitive dashboards that make analytics understandable and manageable for everyone at every level of your organization.
Your organization wants to rely on data-driven insights to inform decisions at all levels of the enterprise. But more and more rows of data rapidly become more and more noise. Data Visualization is the key to unlocking the true stories that your data has always wanted to tell. Building effective visualization on agile and extensible modern data platforms can become the key to unlocking silos of information and driving transformation forward for your career and your enterprise.
Glasban's Data Visualization services helps companies elevate data driven decision -making processes for business executives, software engineers, data scientists and researchers. We work with many global companies across a range of sectors to address their enterprise data virtualization needs. This broad experience helps us discover the disparate data relationships within our clients’ data including uncover important data, faster and more easily.
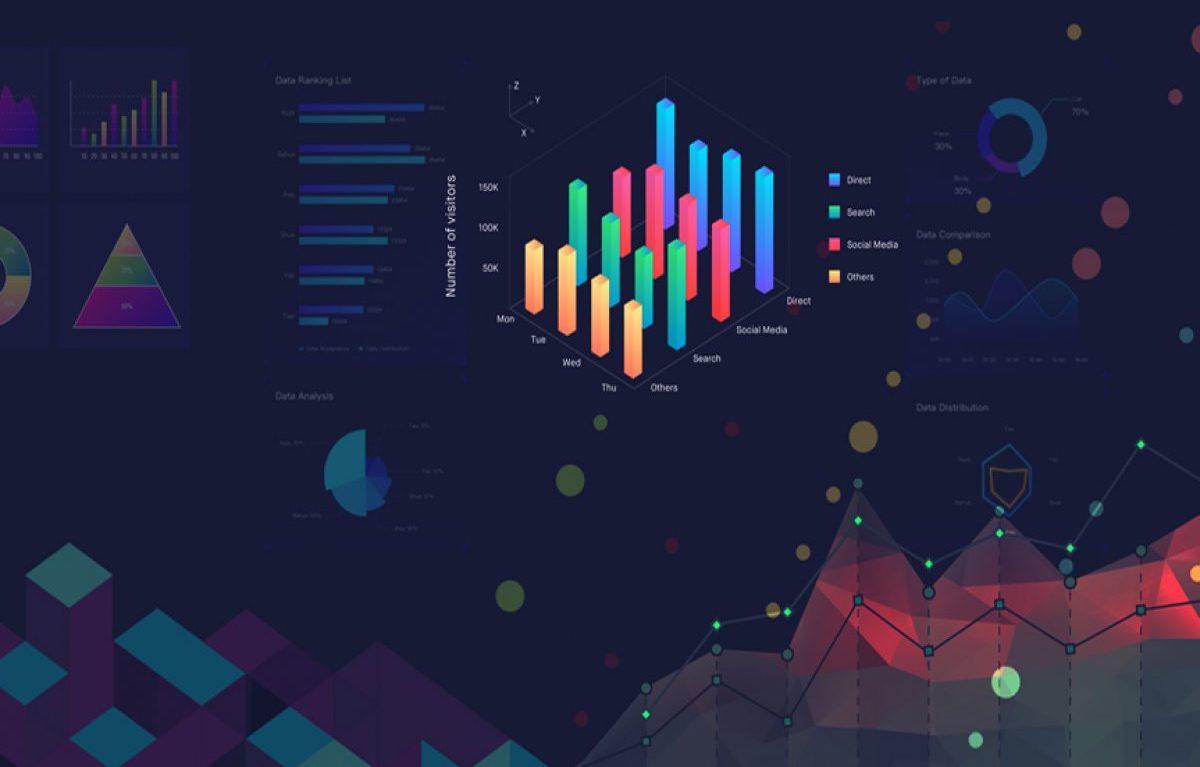
We use innovative tools and approaches such as information dashboards, mobile business intelligence (BI), self-service capabilities, data discovery and interactive data visualization to pull the real value out of data silos.
In brief, we work with you to discover unique insights or business intelligence that can help your organization take advantage of opportunities, minimize risks and control costs.
As one of the growing data visualization companies, our full-cycle analytics services mean that we are not limited to just data visualization offerings, allowing us to consult on data management, data warehouse (including ETL) and data marts development, big data consulting, advanced data analysis and more. We also offer data visualization consultants, and support and maintenance services, covering everything from performance to optimization, as well as further development of your existing data system, as well as migration from one analytical system to another.
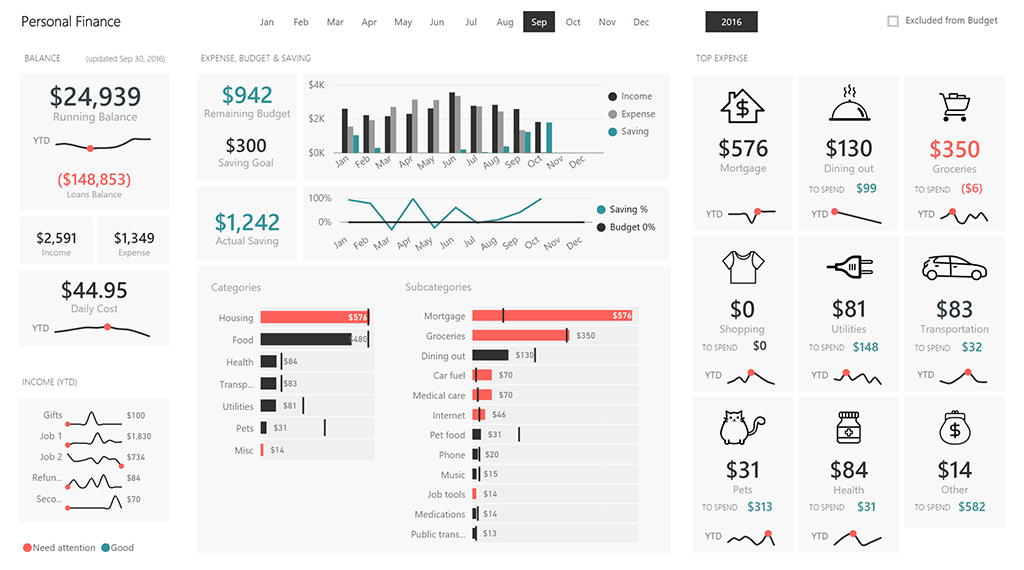
Displaying data properly in a dashboard or in a report means making decisions, designing with a specific target audience in mind, including only the most relevant information, and picking charts carefully. People often create reports just by dropping data on the canvas, without proper planning. Don't worry, we will make it happen all - in extremely effective and efficient way.
Blockchain POC Experts
Team Glasban will help you to bring your Blockchain Ideas and Concepts to the real world.
Get In Touch Now!